What ETFs and Mutual Funds Did Differently In Q4 2025

Every quarter, registered investment companies — mutual funds and ETFs — file N-PORT reports with the SEC, disclosing their holdings, flows, and asset levels. These filings cover a different slice of the market than 13Fs: they capture how funds themselves are growing or shrinking, and which securities they are concentrating in. The Q4 2025 data covers 6,762 funds holding a combined $23 trillion in net assets — and one of the clearest signals in the quarter is how differently ETFs and mutual funds behaved.
ETF inflows nearly doubled quarter over quarter; mutual fund outflows narrowed sharply
In Q3 2025, mutual funds in aggregate saw $300 billion more leave than enter. By Q4, that gap had compressed to $39 billion in net outflows. A meaningful chunk of the Q3 pressure traces to a small number of very large Vanguard index funds — the Vanguard 500 Index Fund alone reported $186 billion in net redemptions during Q3, a figure that reversed to $31 billion in net inflows by Q4. ETF flows moved in the opposite direction: $102 billion in Q3 became $193 billion in Q4, continuing the structural trend of capital flowing toward the exchange-traded wrapper.
Across the year in this dataset, ETF net inflows have stayed positive every quarter while mutual fund flows have oscillated between slight positives and significant negatives. That pattern is consistent with broader industry data showing record ETF inflows in 2025 alongside sustained mutual fund attrition.
ETFs carry more concentrated positions; mutual funds hold more names
ETFs in this dataset averaged 202 holdings per fund in Q4, compared to 362 for mutual funds. The top-10 concentration tells a related story: ETFs averaged 51.3% in their top-10 positions, while mutual funds averaged 46.5%. That gap is partly structural — index ETFs that track narrow benchmarks will naturally concentrate in a small number of names — but it also reflects how the two vehicles are being used. The 159 new ETFs that appeared in the Q4 dataset for the first time, against just 9 new mutual funds, suggests where new product development is focused.
Microsoft, NVIDIA, and Broadcom top the equity universe by weight and breadth
Among the 34,000-plus distinct ticker-level positions tracked across equity-like holdings in Q4 2025, a handful of names stand out both by the number of funds holding them and by average portfolio weight. The Mag-7 names dominate the top of the fund-count table, but a few names beyond that cluster carry notably high average weights:
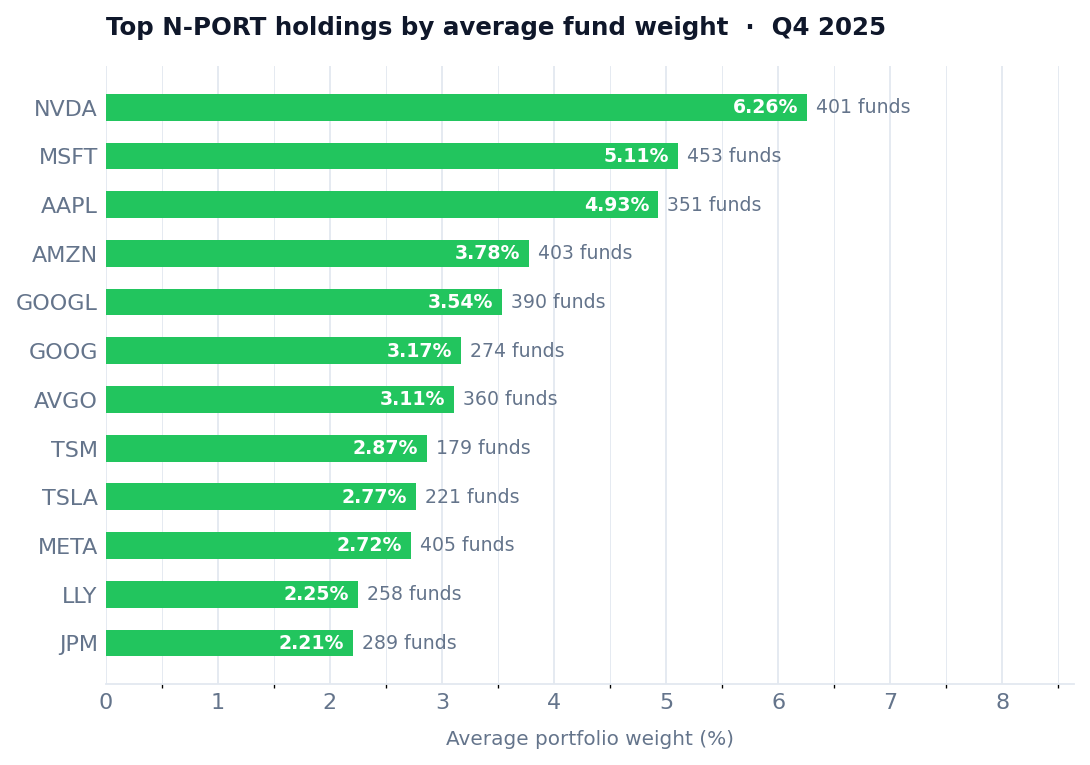
Average portfolio weight among funds holding each name, equity-like holdings, Q4 2025. Fund counts shown at right.
- Microsoft (MSFT) — held by 453 funds, average weight 5.1%
- NVIDIA (NVDA) — held by 401 funds, average weight 6.3%
- Broadcom (AVGO) — held by 360 funds, average weight 3.1%
- Apple (AAPL) — held by 351 funds, average weight 4.9%
- Amazon (AMZN) — held by 403 funds, average weight 3.8%
- Meta Platforms (META) — held by 405 funds, average weight 2.7%
NVIDIA's 6.3% average weight across 401 funds is the highest among the most widely held names — meaning funds that own it tend to give it a sizable share of the portfolio, not just a token position.
A cluster of semiconductor names appears broadly held
Looking across the semiconductor space, several names show up in well over 200 funds each — not just the ETF-driven mega-names, but also equipment and memory companies that may reflect broader AI-infrastructure positioning:
- NVIDIA (NVDA) — 401 funds, $99B total market value
- Broadcom (AVGO) — 360 funds, $77B
- Texas Instruments (TXN) — 228 funds
- Applied Materials (AMAT) — 231 funds
- Lam Research (LRCX) — 221 funds
- Micron Technology (MU) — 222 funds, $17B
- KLA Corporation (KLAC) — 189 funds
- ASML Holding (ASML) — 178 funds, average weight 2.0%
The breadth here is notable — these are not just index inclusions but names appearing broadly across active and passive portfolios alike. Whether that reflects conviction on AI hardware demand or simply the weight of index-driven flows, the cluster is one of the denser in the data.
Some large ETFs saw the sharpest turnarounds in flows quarter over quarter
A few specific funds saw the most dramatic swings between Q3 and Q4. The SPDR S&P 500 ETF Trust went from $13 billion in net outflows in Q3 to $24 billion in net inflows in Q4 — a $37 billion swing in a single quarter. The iShares Core S&P 500 ETF added another $12 billion improvement. On the value side, the iShares S&P 500 Value ETF saw flows move from near-flat to $5 billion positive, and the iShares Russell 1000 Value ETF shifted from slight outflows to $3.5 billion inflows. The VanEck Semiconductor ETF and iShares Semiconductor ETF both saw inflows improve by roughly $1.8 billion each, moving from slight outflows in Q3 to positive territory in Q4.
Some mutual funds tightened their portfolios; a few concentrated further
Among the larger active mutual funds, Q4 brought a few concentration increases worth noting. Baron Growth Fund moved from 24 to 19 holdings while its top-10 concentration rose from 76% to 87% — a tighter book, with Arch Capital Group and MSCI Inc. as its two largest positions. Janus Henderson Global Equity Income Fund reduced holdings from 85 to 76 while its top-10 concentration rose nearly 10 percentage points. These are individual fund decisions, but they run somewhat against the broader drift in the data, where average mutual fund holdings stayed roughly flat quarter over quarter.
This data comes from SEC Form N-PORT filings covering the period ending December 31, 2025, compared to September 30, 2025. The 6,762 funds and their holdings are searchable at FilingFrog's securities page, and quarter-over-quarter shifts can be explored on the changes page.
Explore Fund Holdings Data