How to Use FilingFrog
FilingFrog turns SEC ownership filings into approachable stock, ETF, manager, fund, insider, activist, and political-trading research. Here's a tour of every tool and how they fit together.
Up and running in 3 steps
Create a free account
Start with Top Moves, Quarterly Trends, ETF discovery, ownership scores, manager research, and security lookup. Free accounts include the 2 most recent 13F quarters.
Create accountOpen Discover Now
Use the dashboard's Top Moves and quick actions to jump into current filing signals, search a stock, explore Trends, or build an ETF basket without starting from a blank search form.
Research a stock or build an ETF basket
Look up a ticker to see who owns it and how positions changed, or enter up to 10 stocks in the ETF screener to find funds with the exposure and portfolio shape you want.
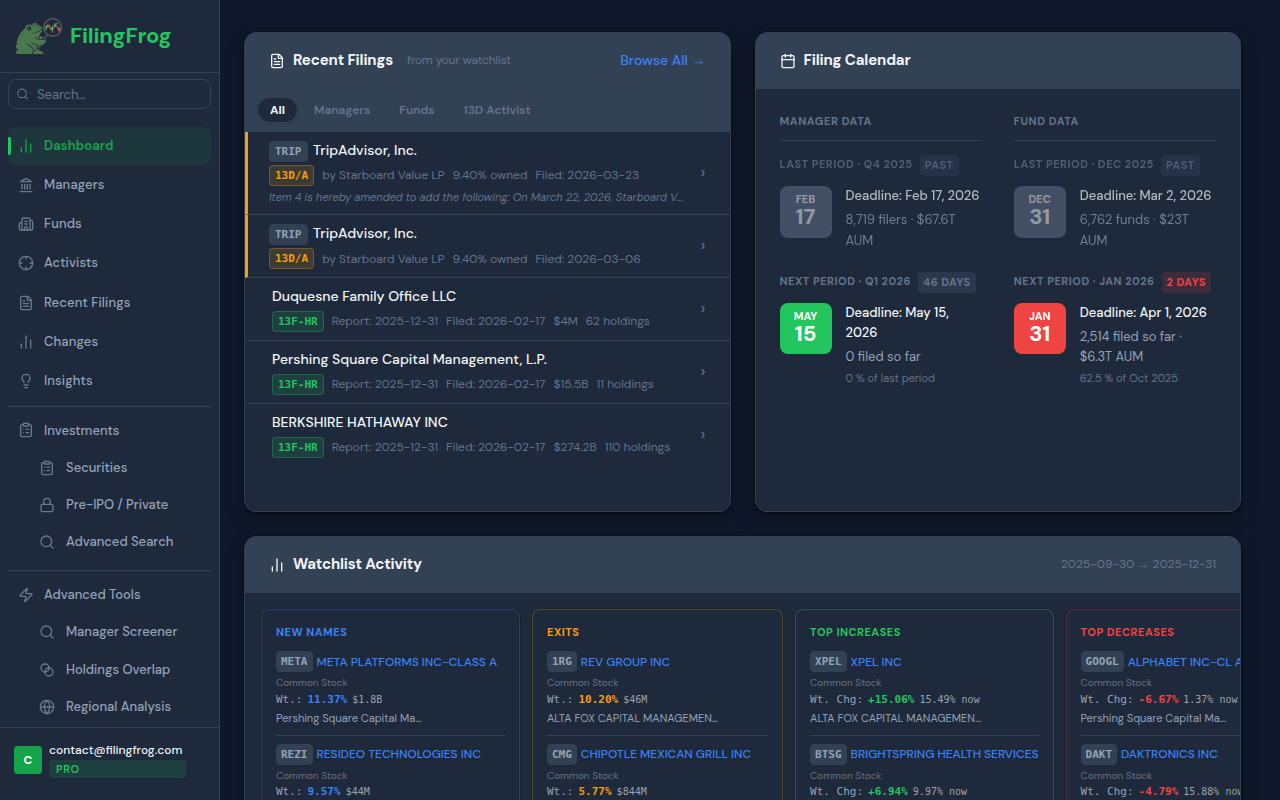
Your personal command center
The dashboard starts with Discover Now: current filing signals and direct paths into the most useful research tasks. Your watchlist activity and filing calendar remain close by for ongoing monitoring.
- Top Moves cards for current institutional activity
- Quick actions for stock lookup, Trends, ETF discovery, and screeners
- Recent filings from watched managers and funds
- Quarter-over-quarter changes for watchlisted securities
- Filing calendar — past deadlines and upcoming dates
Find ETFs by what they actually own
Search an ETF by name or ticker, explore ETFs behind stocks making current moves, or build a basket of up to 10 stocks. FilingFrog screens the latest SEC-reported fund portfolios as one result per ETF series, avoiding duplicate share classes.
- Match any or all basket stocks and exclude names you do not want
- Rank by basket exposure, recent weight additions, reported asset growth, breadth, or size
- Filter by minimum assets, holdings count, top-10 concentration, and filing history
- Compare exposure, recent weight change, net assets, asset change, holdings, and concentration
- Free and Premium return up to 5 matches per screen; Pro returns up to 500
ETF assets come from the latest available SEC fund portfolio filing. A change in reported net assets can include market movement and is not the same as pure investor inflow.
Explore ETFs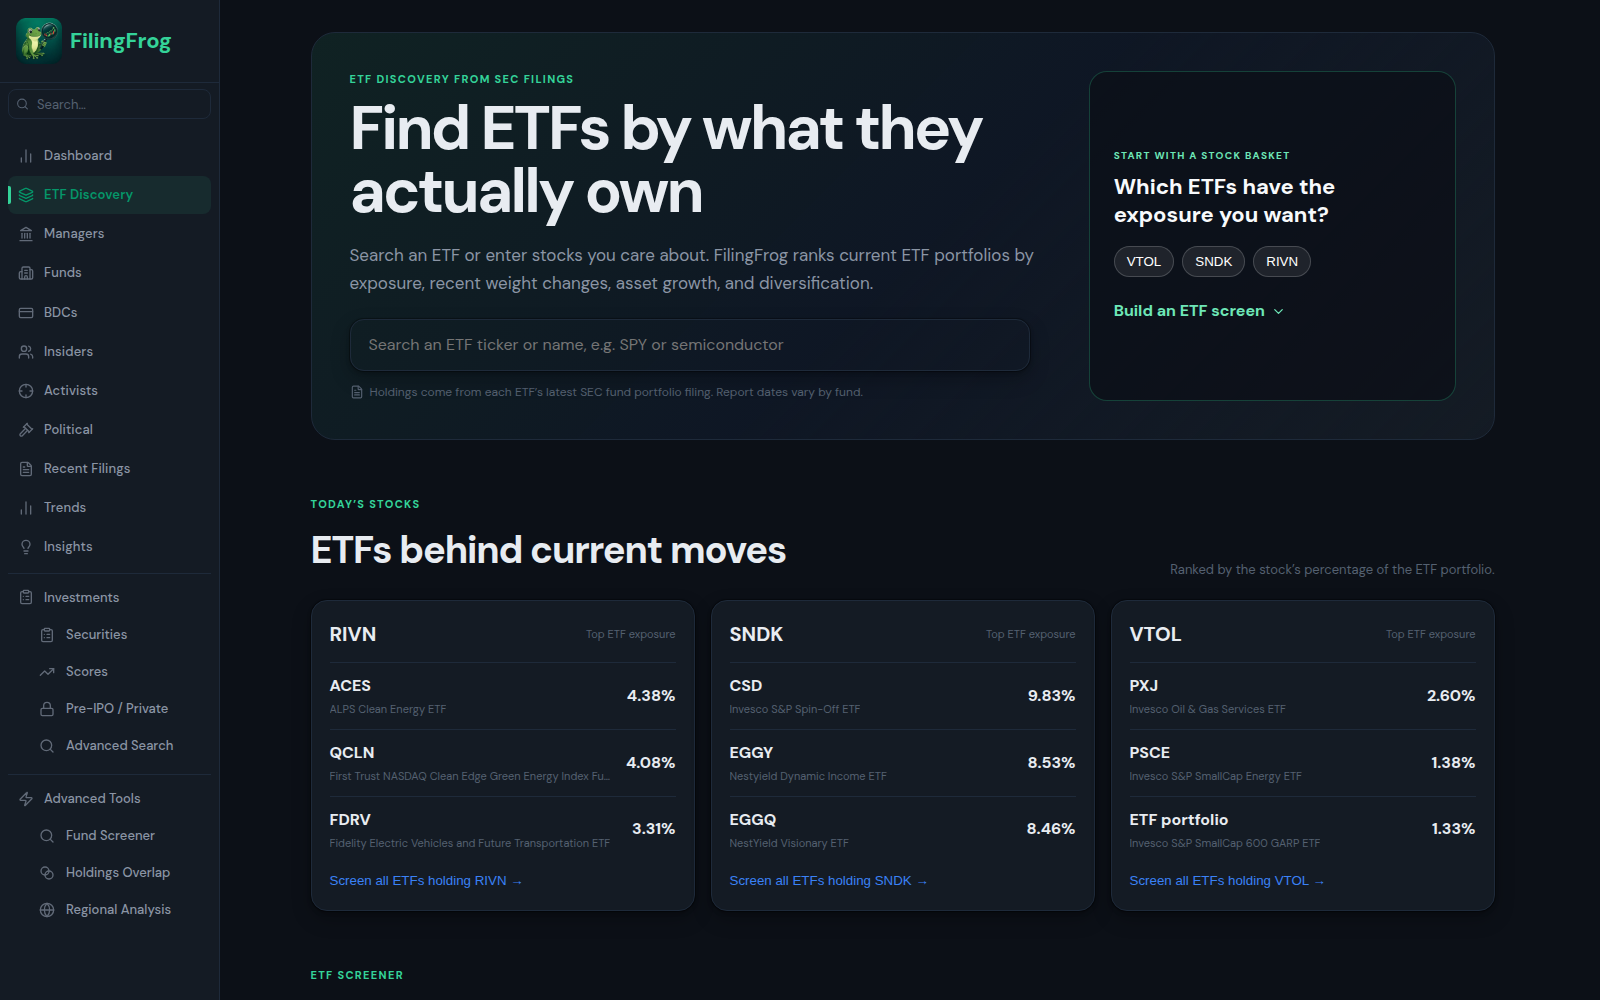
Institutional manager profiles
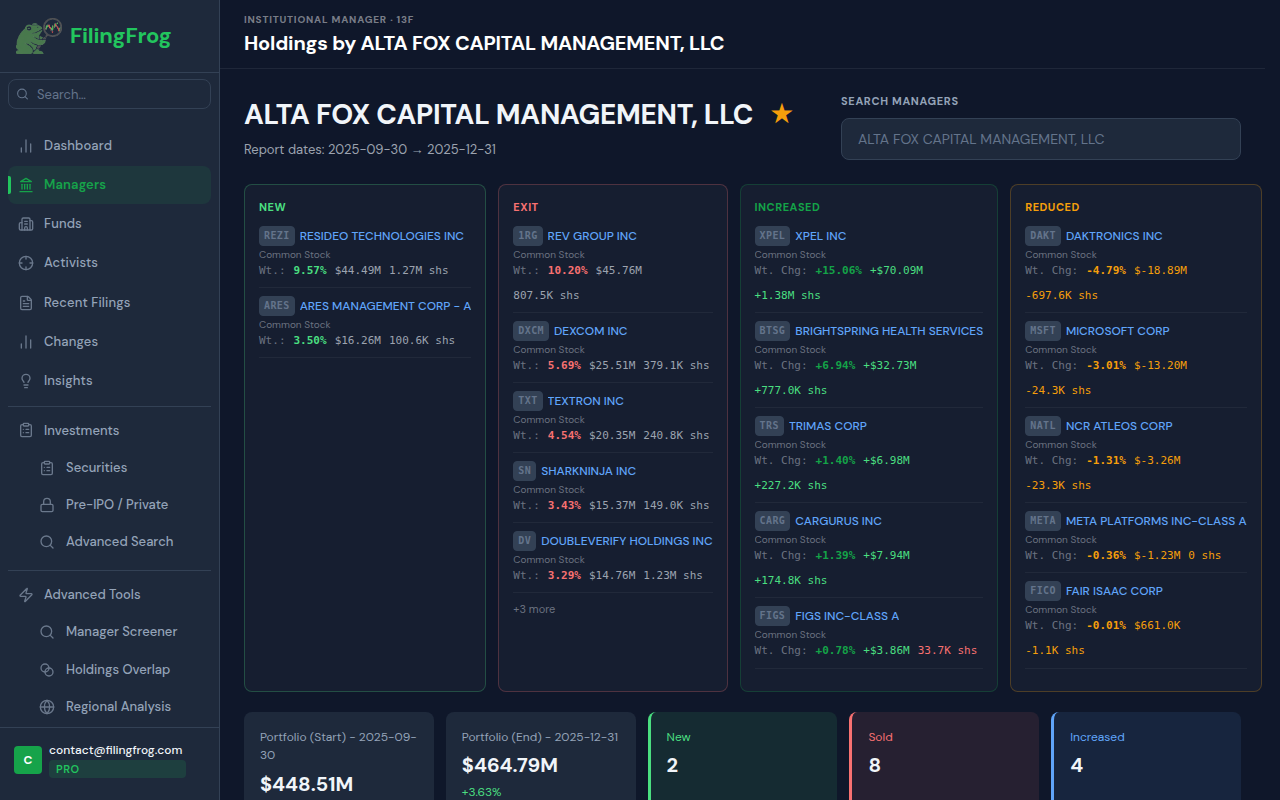
Look up any of the 8,000+ institutional managers that file 13Fs with the SEC. See their holdings, AUM trend over time, and exactly what changed between quarters — new buys, exits, increases, and trims.
- Search by fund name or CIK number
- Full holdings table with market value and share counts
- AUM history chart across all available quarters
- Quarter-over-quarter changes — new, exit, increased, reduced
- Top-10 concentration and portfolio composition
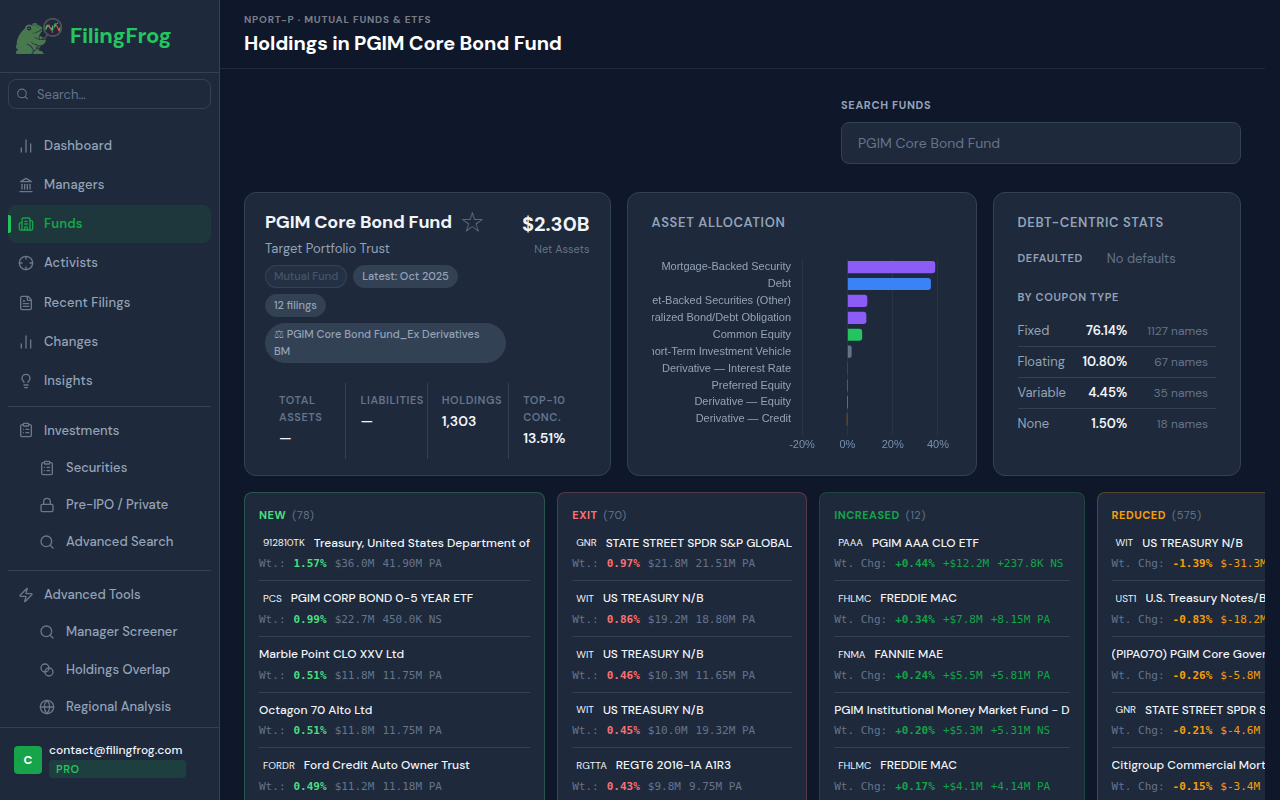
Mutual fund & ETF portfolio drilldowns
Registered mutual funds and ETFs report their portfolios to the SEC. Pro members can open complete fund profiles for individual holdings, asset allocations, debt breakdowns, and reporting-period comparisons. The separate ETF Discovery hub is available on every plan.
- Search by fund name or registrant
- Asset allocation breakdown by category
- Debt-specific stats: coupon type, defaults, and issuers
- Holdings comparison between reporting periods
- Look up which funds hold any given security (by ticker or ISIN)
See who holds any investment
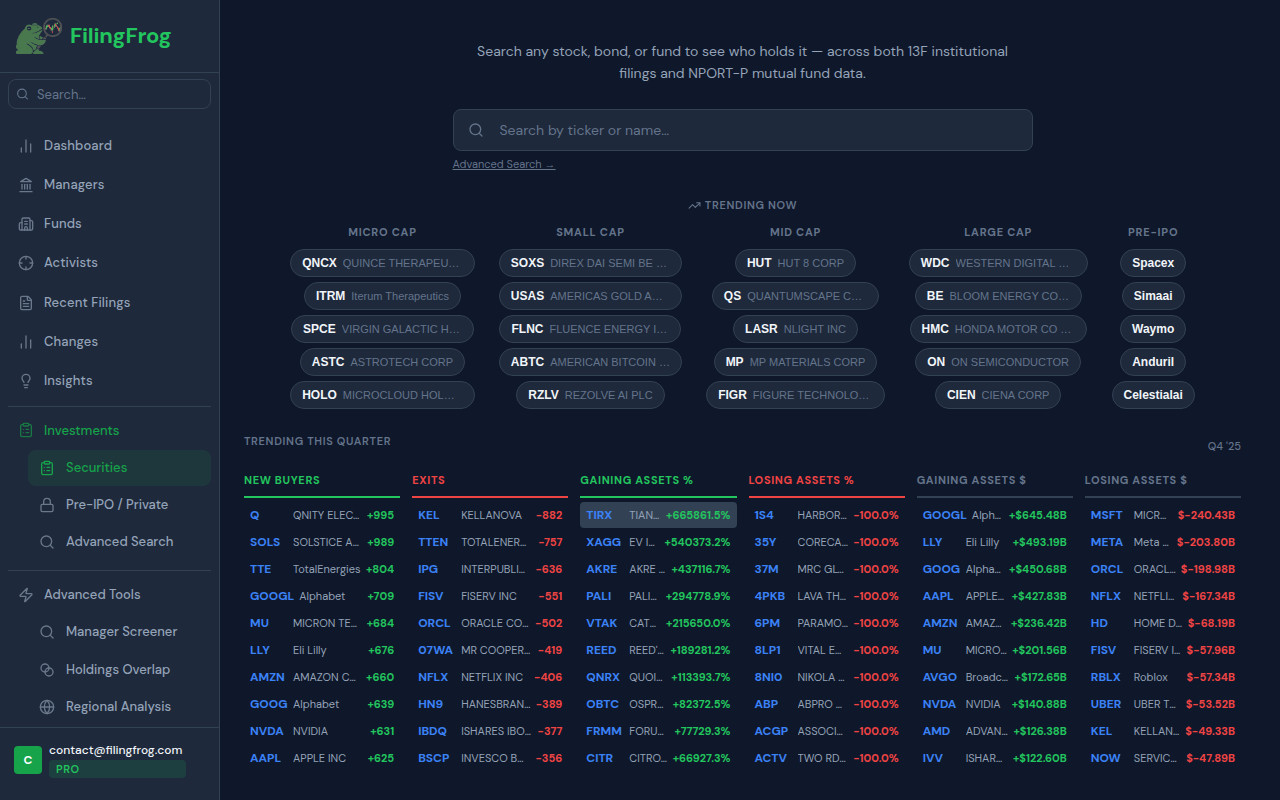
The Securities page is a two-way lookup: search any ticker to see which institutions hold it, or browse current filing signals to discover where reported ownership is moving. The home screen also breaks down the latest quarter's biggest movers.
- Current signals — notable names by cap tier, including pre-IPO
- Trending this quarter — new buyers, exits, largest value gainers and losers
- Click any security to see every institutional holder, ranked by size
- Covers equities, debt, calls, puts, and private company positions
- Advanced search for filtering by security type, AUM, and more
Rank stocks by ownership momentum
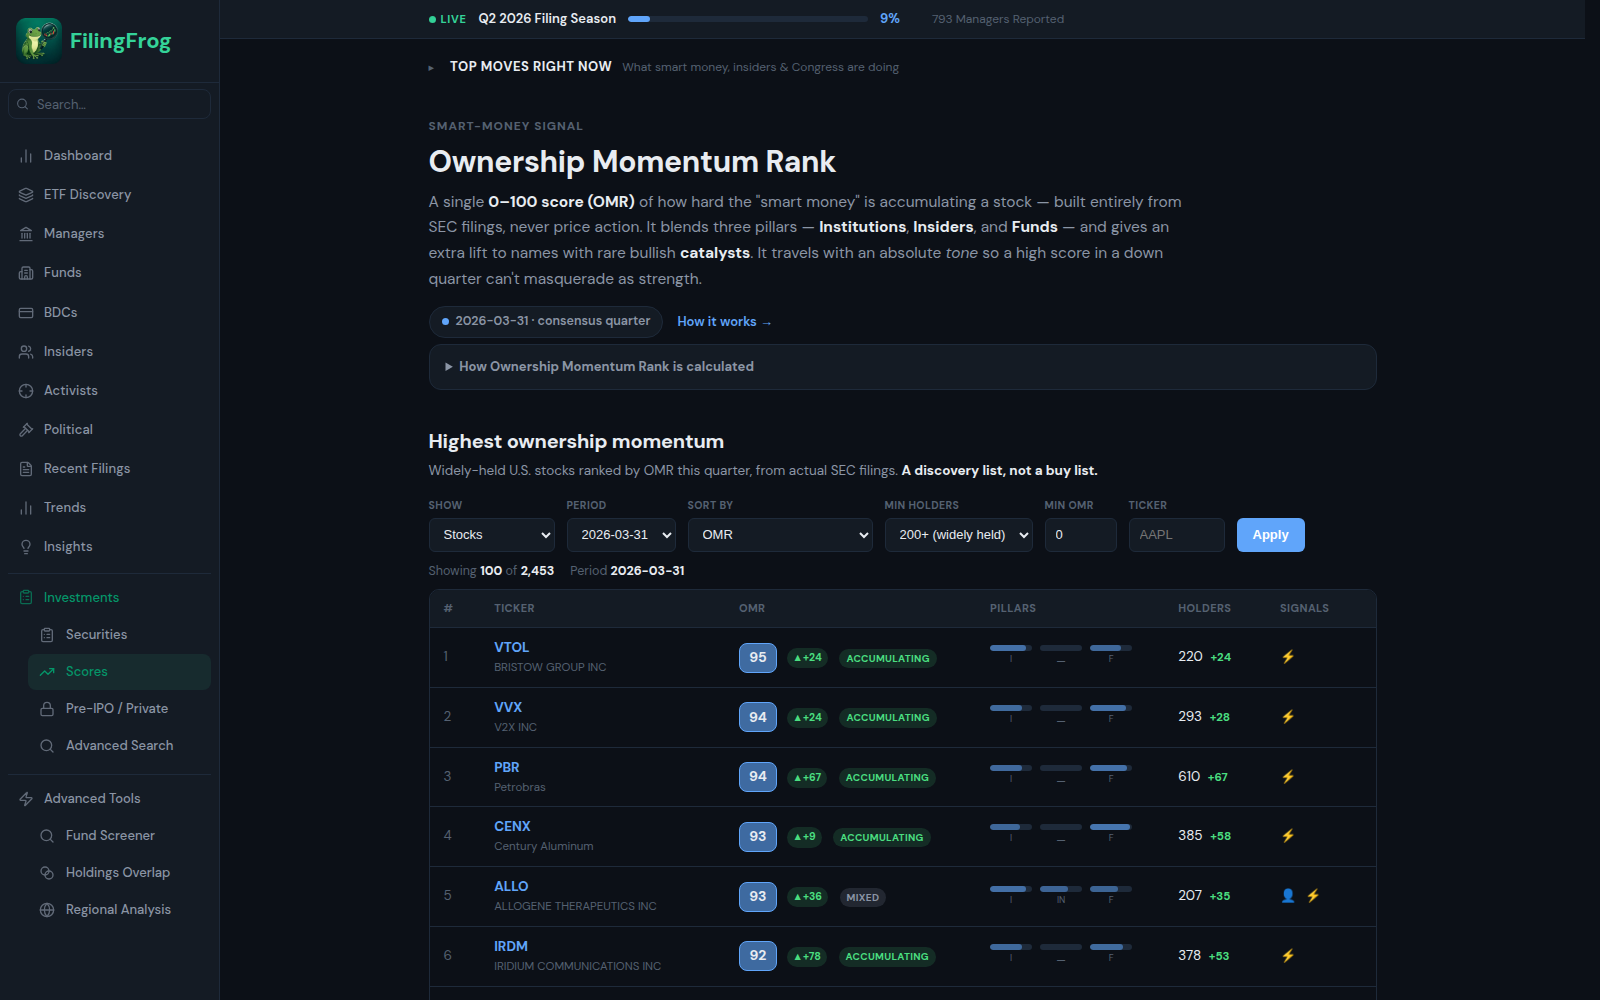
The Ownership Momentum Rank (OMR) distills every ownership filing into a single 0–100 score — how hard the "smart money" is accumulating a stock. It blends three pillars (institutions, insiders, and funds) and gives an extra lift to names with rare bullish catalysts, then travels with an absolute tone so a high score in a down quarter can't masquerade as strength.
- Leaderboard of the highest-momentum, widely-held U.S. stocks each quarter
- Every score shows its pillars and an Accumulating / Reducing / Mixed tone
- Signal flags for activist stakes, Congressional buying, and bullish options skew
- Filter by period, minimum holders, and minimum score — or jump to any ticker
- A discovery list built only from SEC filings — never a buy/sell recommendation
See where institutional money moved
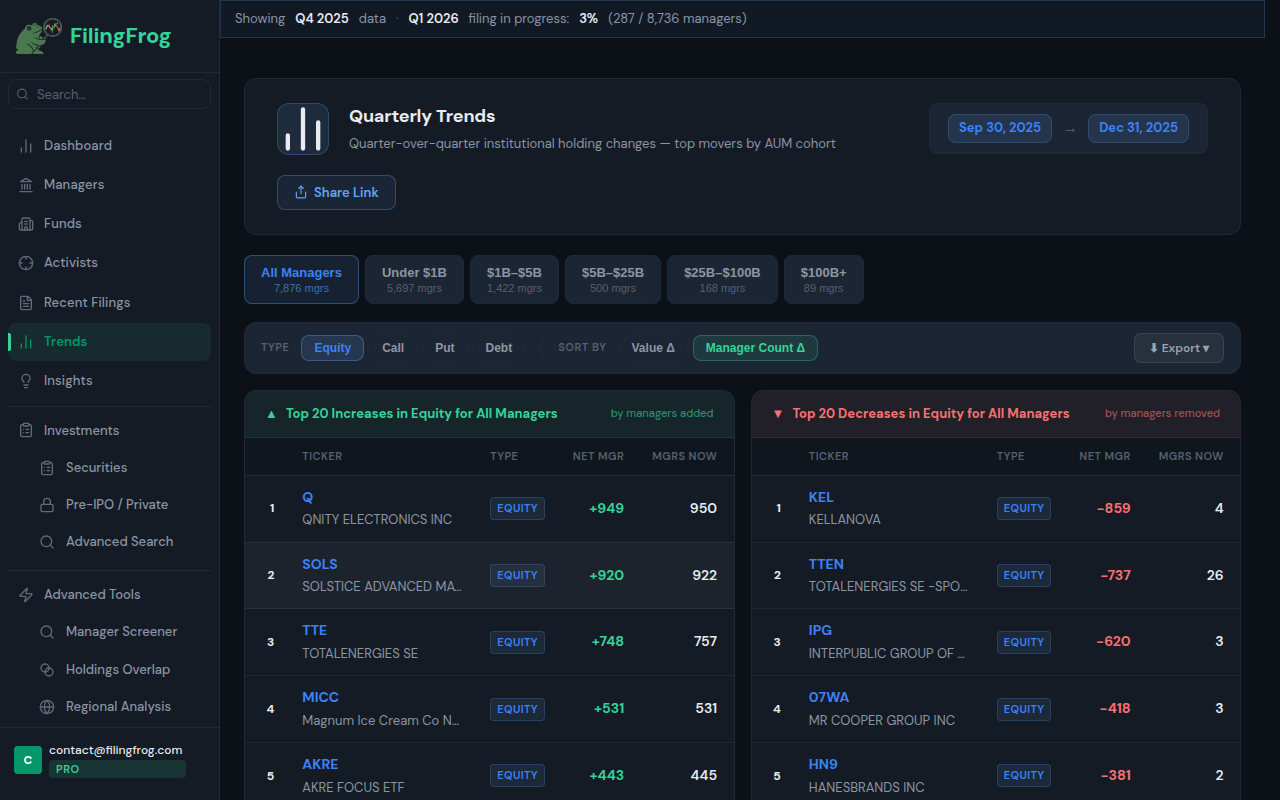
The Trends view aggregates all 13F filings for a reporting period and ranks securities by the number of managers who added or dropped them. It's the fastest way to see broad institutional momentum for any quarter.
- Filter by AUM cohort — under $1B up to $100B+
- Sort by value change or manager count change
- Separate views for equity, calls, puts, and debt
- Available on every plan; exports require Pro and share links require Premium or Pro
Fresh filings as they arrive
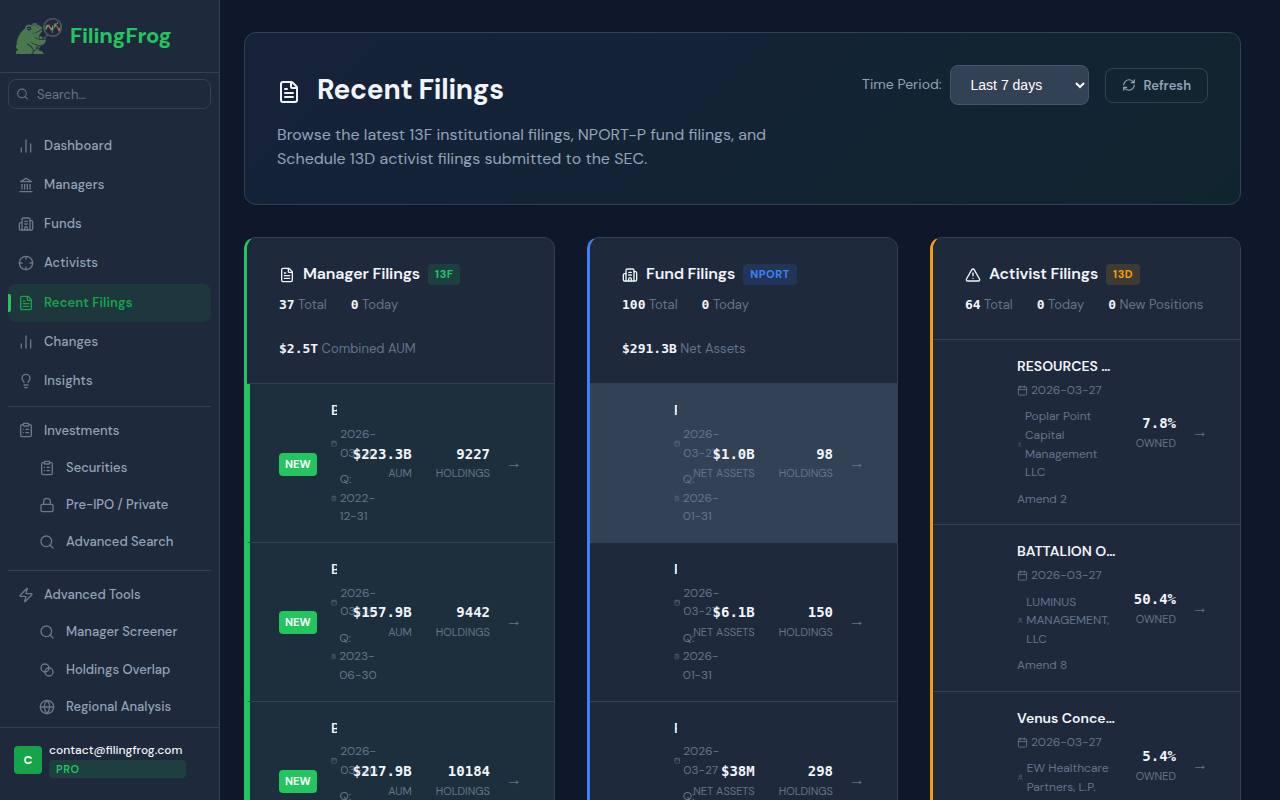
Browse the latest institutional manager, registered fund, and activist ownership filings as they're submitted to the SEC. FilingFrog indexes new filings within hours — useful during the 45-day window after each quarter end when manager filings roll in daily.
- Filter by filing type — Manager, Fund, or Activist
- Sorted by most recently filed, with AUM and holdings count
- Configurable time window — last 7 days, 30 days, or all
- Direct links to EDGAR for original XML filings
For deeper analysis
These tools support deeper, more systematic research. Plan availability is shown on each section: most begin with Premium, while complete fund, private-company, and BDC data require Pro.
Filter thousands of managers at once
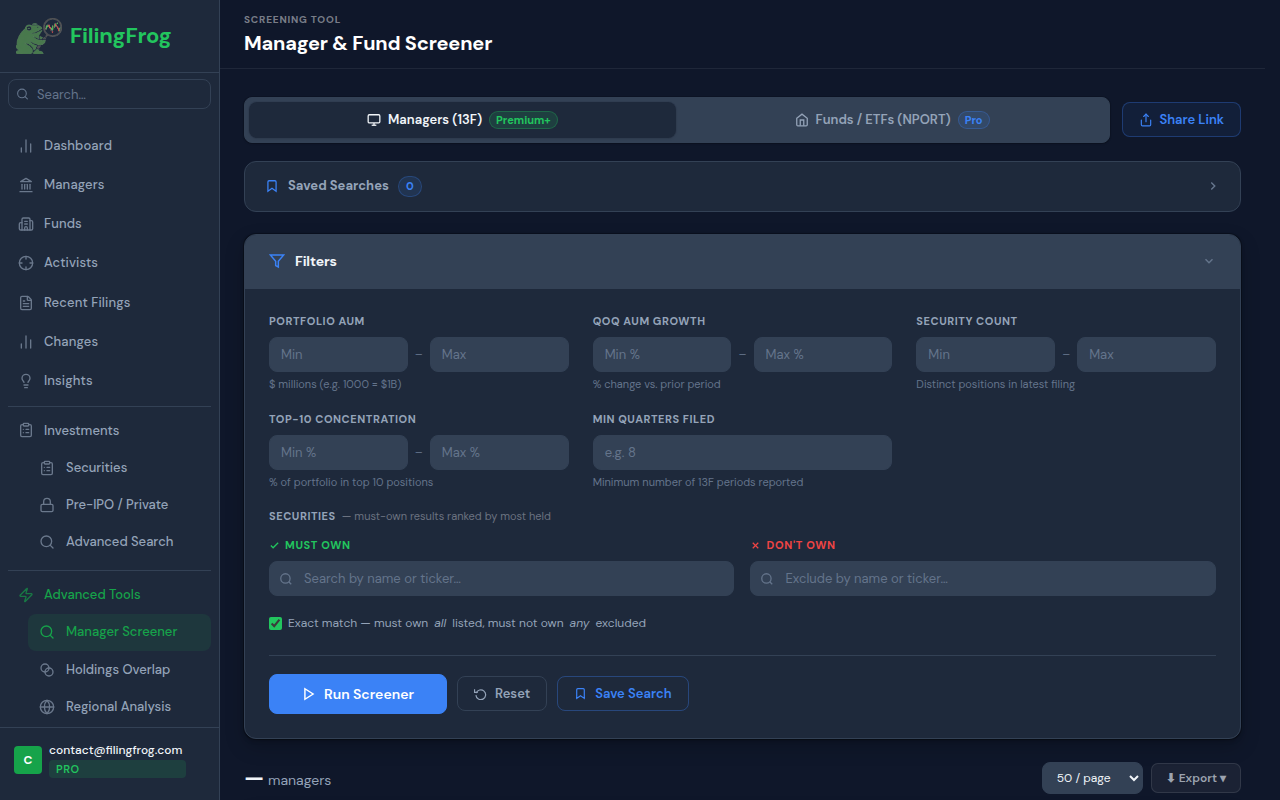
Run structured queries across the entire 13F universe. Set filters on AUM, quarter-over-quarter growth, security count, and portfolio concentration — then narrow further by required or excluded tickers to find exactly the managers you're looking for.
- Min/max AUM filter (in $ millions)
- QoQ AUM growth % — find fast-growing or contracting managers
- Must-own and don't-own ticker filters
- Top-10 concentration threshold
- Review up to 500 results; full CSV, XLSX, and PDF export requires Pro
- Save and re-run searches each quarter
Compare portfolios side by side
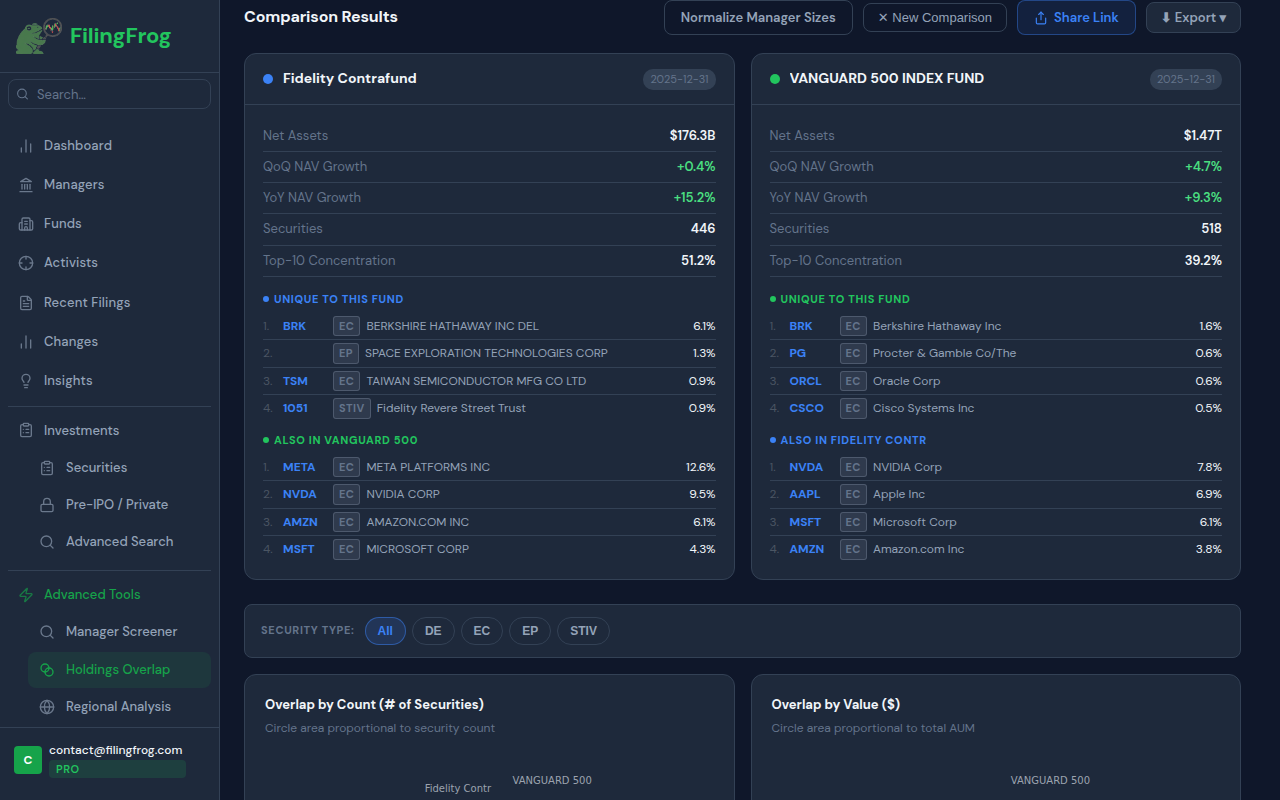
Pick two or more managers and see which positions they share — and which ones are unique. Manager overlap begins with Premium; comparing complete mutual-fund or ETF portfolios requires Pro fund access.
- Compare up to 3 managers or fund series at once
- Works with institutional managers on Premium and Pro, and mutual fund or ETF portfolios on Pro
- Unique-to-fund vs. shared position breakdown
- Bubble chart showing overlap by count and by value
- Share results via a link
Map institutional capital by location
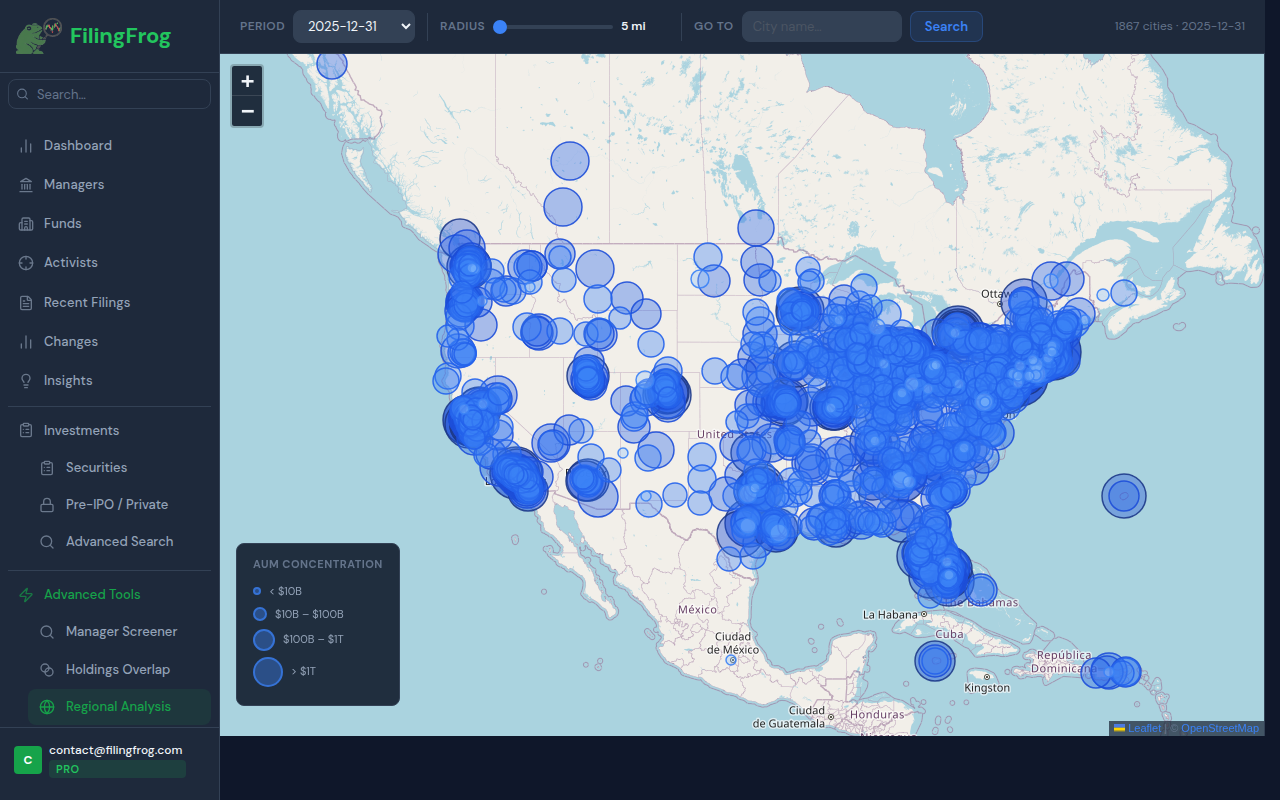
See where institutional AUM is concentrated across the US — plotted on an interactive map by city. Useful for marketers targeting financial firms in a region, anyone researching local investment activity, or analysts comparing capital density between financial hubs.
- Interactive bubble map — circle size reflects AUM
- Set a radius and jump to any city to see managers nearby
- 1,867 cities tracked as of the latest period
- Filter by reporting period to compare across quarters
- Click any bubble to see the full manager list for that city
Track activist investor campaigns
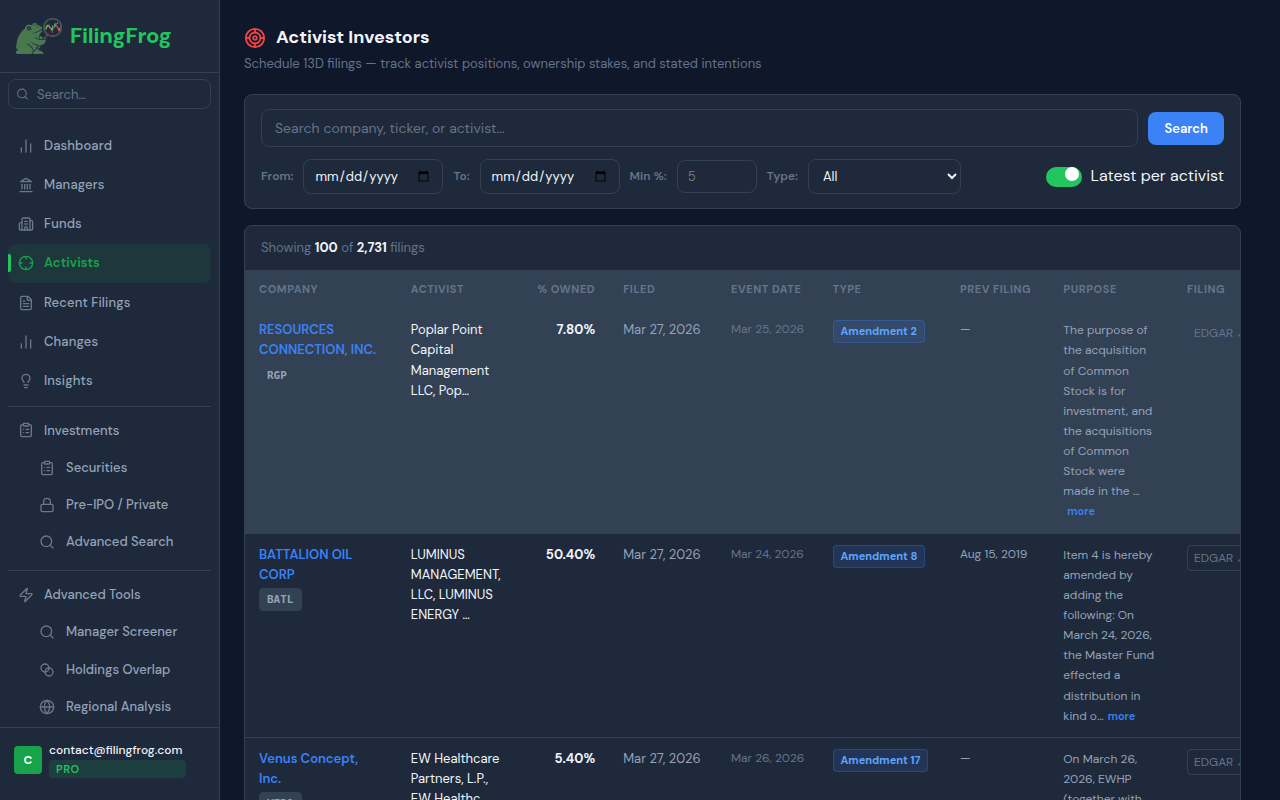
Schedule 13D filings are required when any investor crosses 5% ownership in a public company with intent to influence management. FilingFrog indexes all 13D filings and amendments so you can track activist campaigns as they unfold.
- Search by company, ticker, or activist name
- Filter by date range, ownership percentage, and filing type
- Full purpose/intent text from each filing
- Amendment history — track how a campaign evolves
- "Latest per activist" toggle to reduce amendment noise
See who owns the hottest private companies
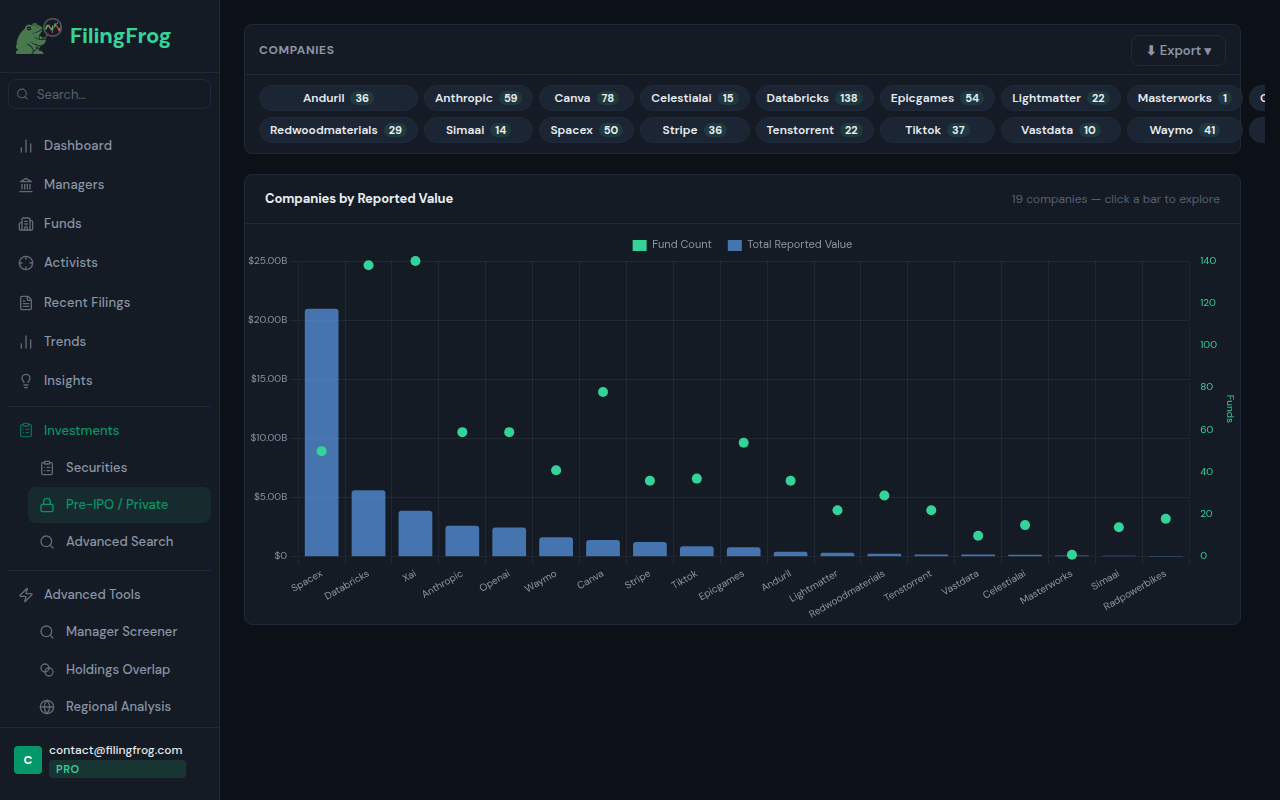
SEC fund portfolio filings reveal which mutual funds hold stakes in private companies before they go public. FilingFrog tracks companies like SpaceX, Databricks, Anthropic, Stripe, and more — showing how institutional valuations shift each quarter.
- Heatmap of private companies ranked by total reported value
- See which funds hold each company and how much they've allocated
- Inferred price history from quarterly fund valuations
- Quarter-over-quarter and year-over-year return tracking
- Export company lists and holder breakdowns
Explore BDC private-credit portfolios
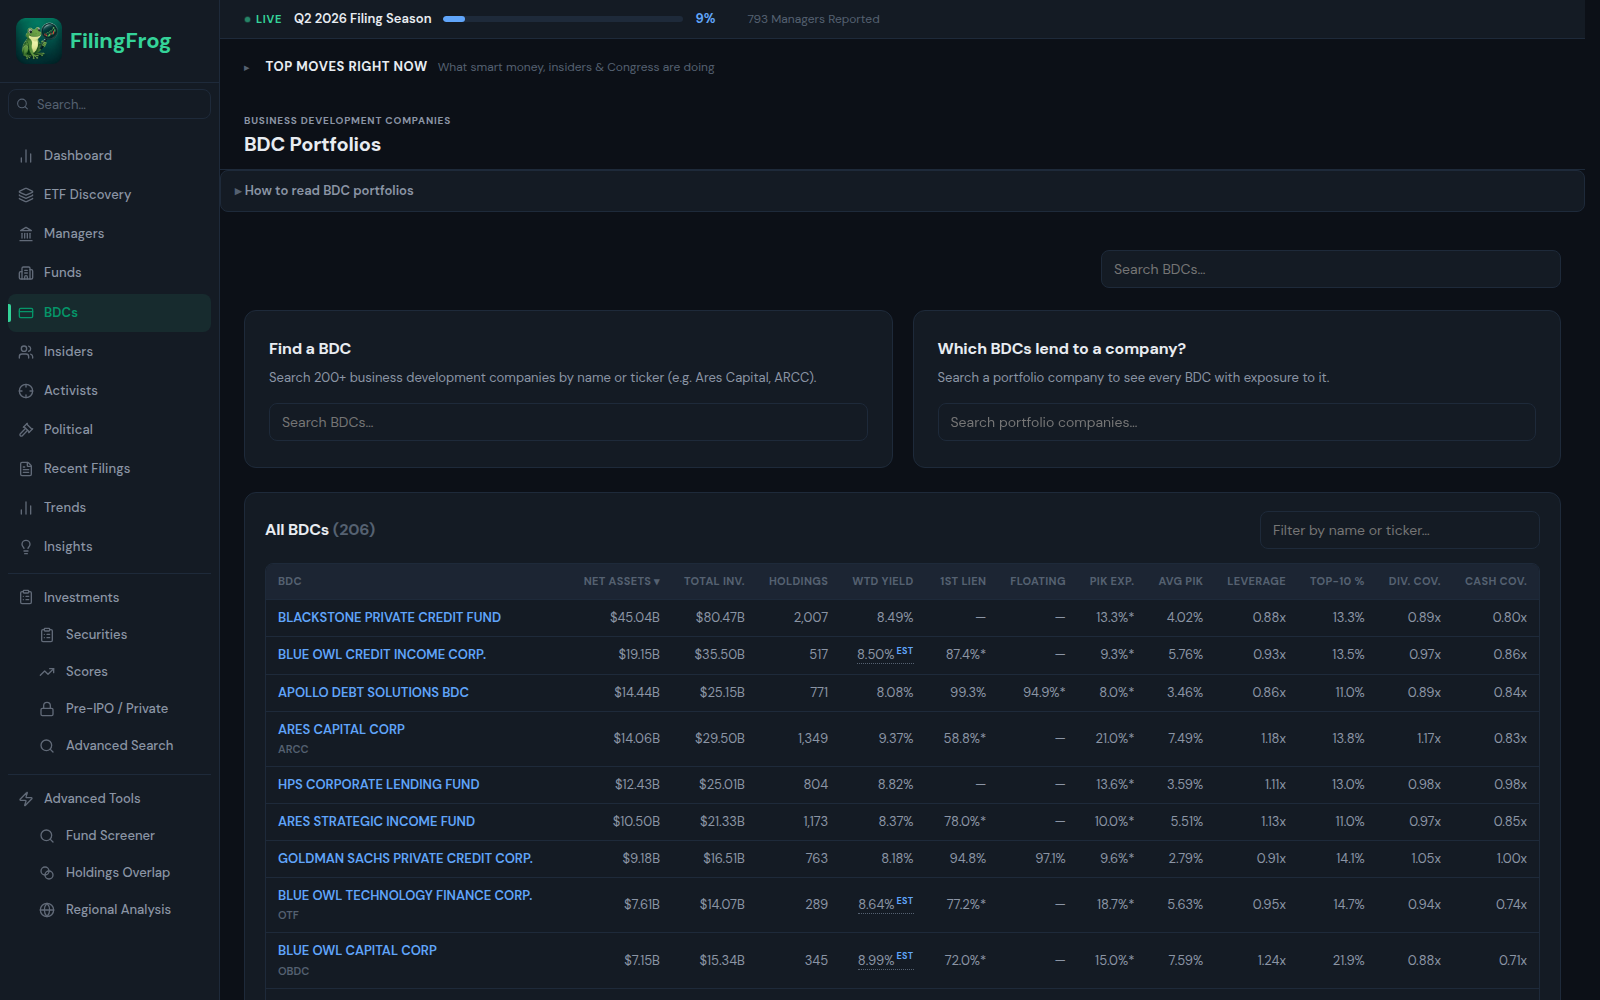
Business development companies (BDCs) lend to and invest in private, mostly middle-market companies. Each quarter they disclose a full schedule of investments. FilingFrog indexes 200+ BDCs so you can see exactly what they hold, on what terms, and how their portfolios shift over time.
- Search any BDC and view its complete schedule of investments
- Loan terms — coupon, reference rate, spread, and maturity
- First-lien / second-lien and PIK (payment-in-kind) breakdowns
- Quarter-over-quarter portfolio changes — new deals, exits, and markups
- "Which BDCs lend to X" — find every BDC exposed to a given borrower
Follow insider buying and selling
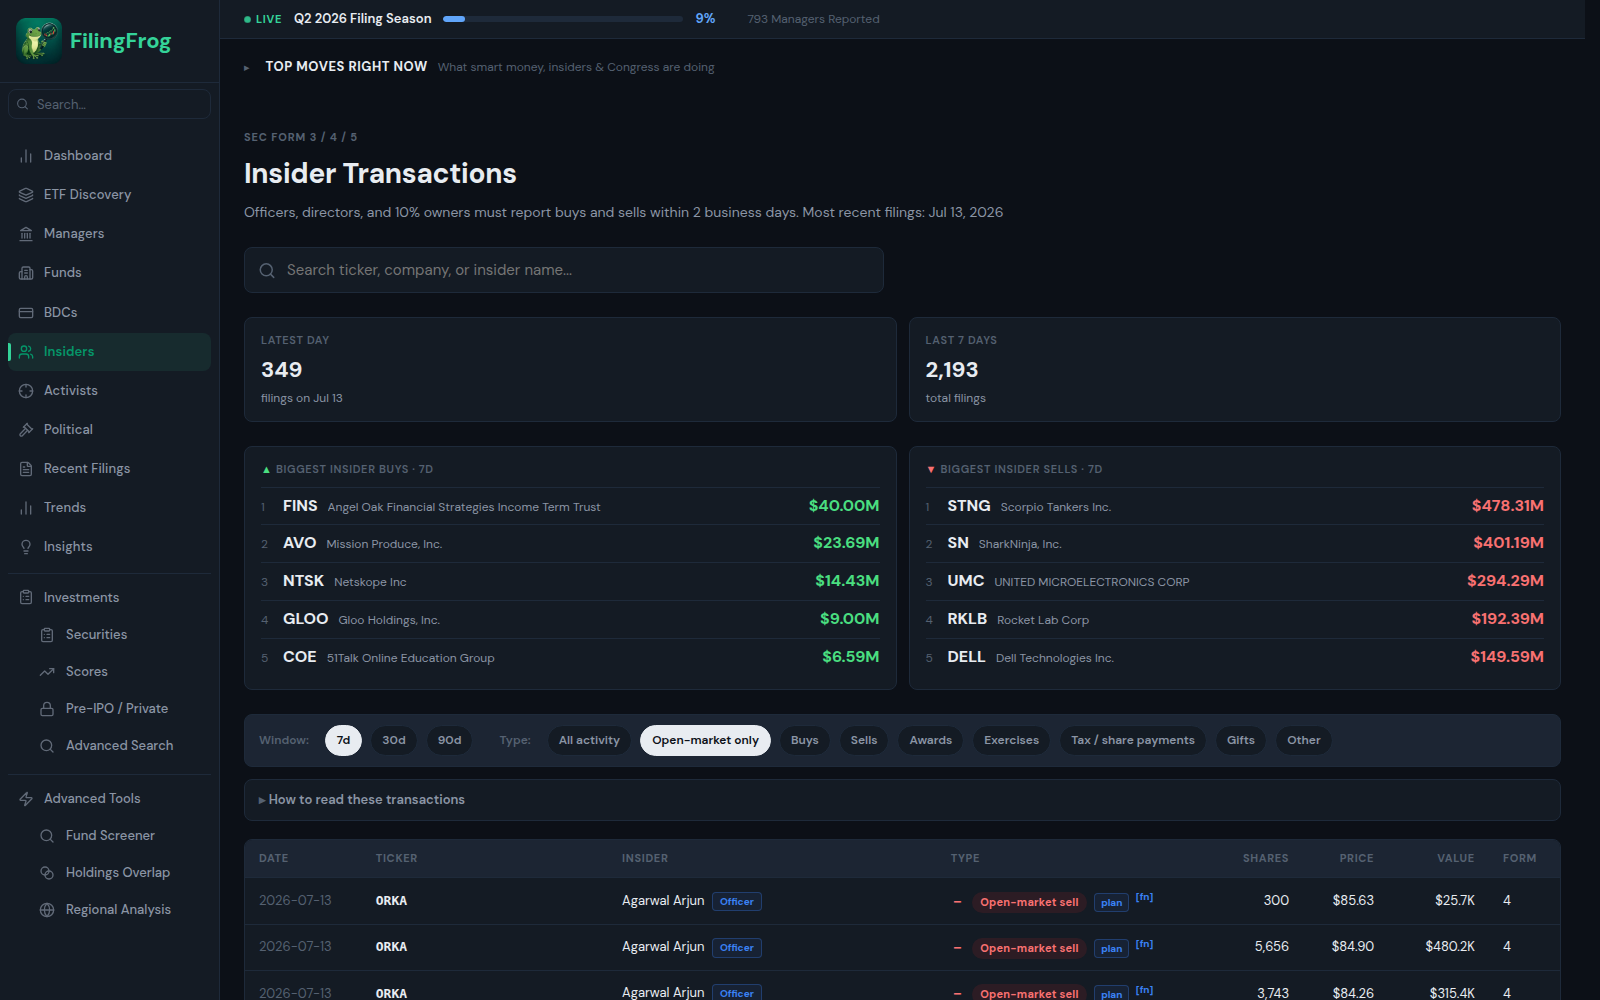
Corporate insiders — executives, directors, and 10% owners — must report their trades to the SEC on Forms 3, 4, and 5. FilingFrog indexes these filings daily so you can see who's buying and selling, in size, across every public company.
- Browse the latest Form 4 transactions across all issuers
- Filter by 7-, 30-, or 90-day windows
- Separate open-market buys and sells from awards, exercises, and gifts
- Drill into any insider, any issuer, or any individual filing
- See transaction size, price, and resulting ownership stake
Get more out of FilingFrog
Insights
Read original analysis on institutional filings — quarterly 13F breakdowns, sector deep-dives, and filing season previews. New articles are published regularly under the Insights tab.
Browse InsightsEmail alerts
Enable email notifications on any watchlisted manager or security. You'll get a morning email when a new filing arrives — no need to log in to check. Toggle alerts from the star icon on your dashboard.
Share links
Premium and Pro members can share a screener filter, changes view, or overlap comparison with a single link. Recipients don't need to be logged in.
Data export
Pro members can export supported holdings, Trends, overlap, and screener tables to CSV, XLSX, or PDF for use in spreadsheets and research workflows.
Ready to start?
Free accounts include Top Moves, Quarterly Trends, ETF discovery and screening, ownership scores, manager research, security lookup, and the 2 most recent 13F quarters. No credit card required.